 luckpanda
Supplier Performance Metrics: 10 KPIs, Formulas and a Worked Example
Formulas for the 10 supplier KPIs a small business can calculate from its POs, GRNs and invoices: OTIF, defect PPM, lead time, PPV and more, with a worked scorecard.
On this page
- Supplier KPI formula table
- What are the key supplier performance metrics?
- How do you calculate on time in full?
- Counting receipts or counting quantity?
- How is supplier defect rate measured?
- How do you measure lead time and lead time variance?
- How do you measure price variance and invoice accuracy?
- What is PO acknowledgment rate?
- How do you turn the metrics into one supplier score?
- How often should supplier performance be reviewed?
- Where the data comes from in practice
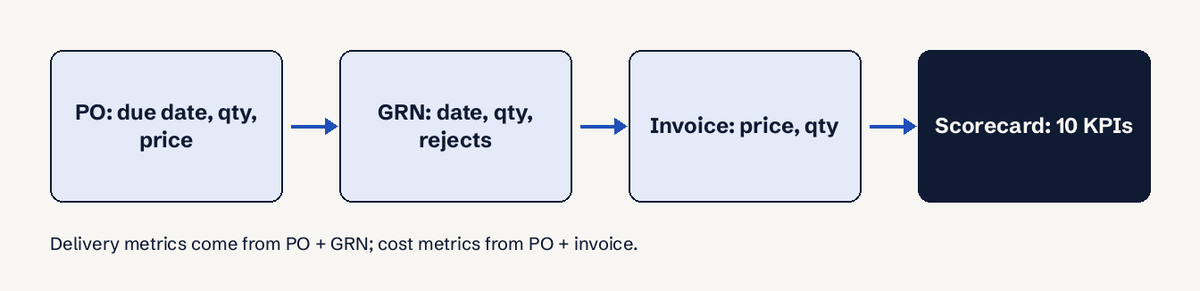
TL;DR: Supplier performance metrics are the numbers that show whether a supplier delivers on time, in full, at the agreed price and quality. The core set is on-time delivery, OTIF, fill rate, defect rate (or PPM), lead time and its variance, price variance, invoice accuracy and PO acknowledgment rate. Every one of them can be calculated from three documents a small business already has: the purchase order, the goods received note (GRN) and the supplier invoice.
Supplier performance metrics (also called supplier KPIs or vendor performance metrics) are standard measurements of how reliably a supplier meets what was agreed on delivery, quantity, quality, cost and responsiveness. ERP vendors group them the same way: Oracle PeopleSoft tracks on-time, quantity, quantity ordered versus received, and quality metrics; SAP S/4HANA scores suppliers on price, quality, delivery, service, invoice verification and sustainability, usually on a 1 to 100 scale. The table below is the lookup: each metric, its formula, and which document supplies the data.
Supplier KPI formula table
| # | Metric | Formula | Data from | Category |
|---|---|---|---|---|
| 1 | On-time delivery (OTD) | PO lines received by the due date / PO lines received x 100 | PO due date, GRN date | Delivery |
| 2 | On time in full (OTIF) | PO lines received on time and in full / PO lines received x 100 | PO, GRN | Delivery |
| 3 | Fill rate (quantity accuracy) | Units received / units ordered x 100 | PO qty, GRN qty | Delivery |
| 4 | Defect rate | Units rejected / units received x 100 | GRN, inspection or return note | Quality |
| 5 | Defect PPM | Units rejected / units received x 1,000,000 | GRN, inspection or return note | Quality |
| 6 | Average lead time | Sum of (GRN date - PO date) / number of PO lines, in days | PO date, GRN date | Delivery |
| 7 | Lead time variance | Actual lead time - quoted lead time, in days | Quotation, PO, GRN | Delivery |
| 8 | Purchase price variance (PPV) | (Invoice price - agreed price) x quantity | Price list or PO, invoice | Cost |
| 9 | Invoice accuracy | Invoices matched first time / invoices received x 100 | PO, GRN, invoice | Cost |
| 10 | PO acknowledgment rate | POs confirmed within the agreed time / POs issued x 100 | PO sent date, supplier reply | Responsiveness |
Measure each metric per PO line, not per PO. One purchase order often has lines with different items and due dates; scoring the whole PO as late when one line slips hides which item is the problem, and scoring it on time when one line is fine hides the miss.
What are the key supplier performance metrics?
The key supplier performance metrics fall into four groups: delivery, quality, cost and responsiveness. The US Postal Service's supplier manual lists cost, quality, delivery, responsiveness and technology as the major categories, and asks that metrics be SMART: specific, measurable, actionable, relevant and timely. For a business buying from 10 to 50 suppliers, the 10 metrics in the table are enough; adding more mostly adds reporting work.
A sensible starting set for a small business is four: OTIF (delivery), defect rate (quality), PPV (cost) and invoice accuracy (cost and admin). They need no extra data collection beyond dating every GRN and recording rejected quantity on it.
How do you calculate on time in full?
OTIF is the share of PO lines that arrived by the due date and with the full ordered quantity. A line that is late, short, or both counts as a miss.
OTIF = PO lines delivered on time and in full / total PO lines due in the period x 100
Worked example (an illustrative supplier, not a real account): six PO lines from one packaging supplier in September.
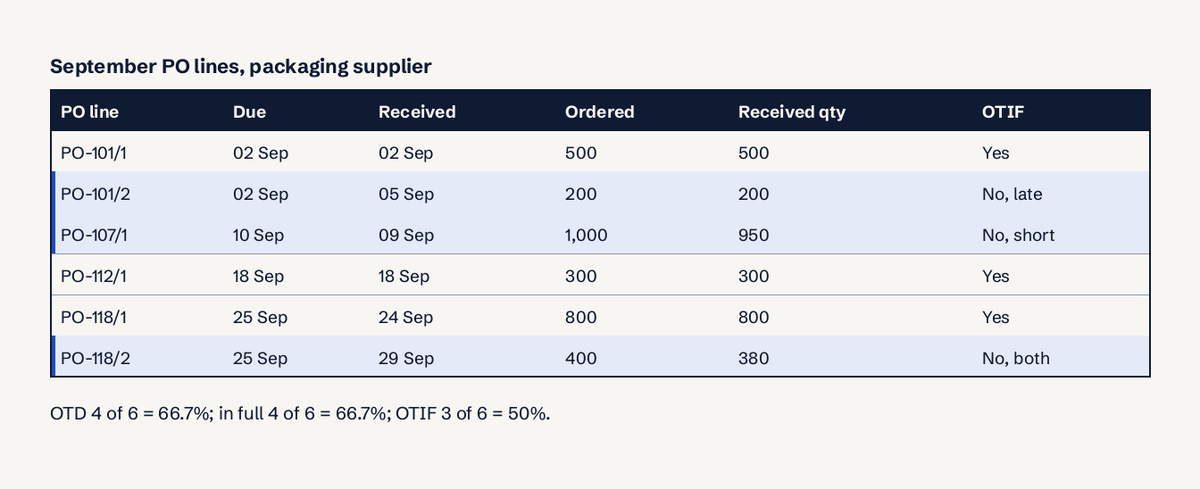
- On-time delivery: 4 of 6 lines arrived on or before the due date = 66.7%.
- In full: 4 of 6 lines arrived with the full quantity = 66.7%.
- OTIF: 3 of 6 lines were both = 50%.
- Fill rate: 3,130 units received / 3,200 ordered = 97.8%.
OTIF is always equal to or lower than either OTD or the in-full rate, which is why it is the stricter headline number. A fill rate of 97.8% looks healthy while OTIF is 50%, because shortfalls were spread across lines.
Decide three rules before you start, and write them into the PO terms so the supplier measures the same way:
- On time window: is a delivery 1 day early on time? A common choice is a window such as 2 days early to 0 days late; early stock costs storage and cash.
- In full tolerance: is 98% of the quantity "in full"? Common for bulk goods; exact quantity for counted items.
- Which date: the date goods reach your door (the GRN date), not the supplier's dispatch date.
Counting receipts or counting quantity?
The same deliveries give very different numbers depending on whether you count receipts or units. Oracle's PeopleSoft documentation gives the example: one shipment of 100 pieces due on 15 February arrives as 10 on 11 February, 10 on 12 February, 10 on 13 February and 70 on 15 February. Counted by receipts, 3 of 4 receipts were early, a 75% early metric. Counted by quantity, 30 of 100 units were early, a 30% early metric. For quantity, 3 of 4 receipts were short (75% under), yet the PO received 100% of what was ordered. Pick one method, label it on the scorecard, and do not switch mid-year.
How is supplier defect rate measured?
Supplier defect rate is the share of received units that fail inspection or are returned for quality reasons.
Defect rate = units rejected / units received x 100 Defect PPM = units rejected / units received x 1,000,000
Example: 12,000 cartons received in a quarter, 36 rejected for crushed corners. Defect rate = 36 / 12,000 x 100 = 0.3%, which is 3,000 PPM. PPM (parts per million) is the better unit once defect rates fall below 1%, because 0.3% and 0.05% look similar while 3,000 PPM and 500 PPM do not.
Three rules keep the number honest:
- Count only quality reasons. Oracle lets buyers untick an "Include in Quality Metric" flag on reject reason codes so that, for example, an incomplete shipment does not count as a quality defect. Do the same: shortages belong in fill rate, not defect rate.
- Record rejects on the GRN. A defect found three weeks later on the shop floor still belongs to that GRN; note the GRN number on the return.
- Units, not lots, for counted items. For bulk goods (kg, litres), use rejected quantity over received quantity in the same unit.
How do you measure lead time and lead time variance?
Lead time is the number of days from placing the order to receiving it. Lead time variance is how far that actual figure is from what the supplier quoted.
- Lead time = GRN date - PO date (days)
- Lead time variance = actual lead time - quoted lead time (days)
Example: the supplier quotes 10 days. Over 20 PO lines, average actual lead time is 12.5 days, so variance is +2.5 days. A positive variance means your reorder points are too low: if you use 40 cartons a day, 2.5 extra days is 100 cartons of extra safety stock you need to hold. Some teams start the clock at PO acceptance rather than PO date; either works if it is applied to every supplier.
How do you measure price variance and invoice accuracy?
Price variance compares what the supplier invoiced with what you agreed; invoice accuracy measures how often an invoice matches the PO and GRN the first time.
PPV = (invoice unit price - agreed unit price) x quantity invoiced
Example: agreed price ₹42.00 per carton; 1,000 cartons invoiced at ₹43.50. PPV = (43.50 - 42.00) x 1,000 = ₹1,500 unfavourable. Report the total per supplier per quarter and as a percentage of spend: ₹4,200 of PPV on ₹6,00,000 of purchases is 0.7%. Our purchase price variance guide covers favourable and unfavourable PPV and the journal entries.
Invoice accuracy = invoices that pass three-way match first time / invoices received x 100
Example: 22 invoices in the quarter, 19 matched PO and GRN on quantity, price and tax without a query = 86.4%. Each failed invoice costs your accounts payable team a query, a credit note or a revised invoice. The accounts payable process guide shows where the three-way match sits.
What is PO acknowledgment rate?
PO acknowledgment rate is the share of purchase orders the supplier confirms (quantity, price and date) within an agreed time. It is a leading indicator: a supplier that does not confirm an order is the one most likely to deliver it late.
PO acknowledgment rate = POs confirmed within the agreed time / POs issued x 100
Example: 20 POs issued; 18 confirmed within 2 working days = 90%. Track it by asking suppliers to reply to the PO email with "confirmed" and the delivery date, and log the reply date against the PO.
How do you turn the metrics into one supplier score?
A supplier scorecard combines the metrics into one weighted score so that suppliers in the same category can be compared. SAP S/4HANA scores each main criterion from 1 to 100 and applies weighting keys: with price weighted 3 and delivery weighted 1, an 80 on price counts three times and a 90 on delivery once. SourceDay's example weighting for manufacturers is delivery 35%, quality 25%, responsiveness 20%, cost alignment 10% and commitment accuracy 10%.
A simple version for a small business, using the September and quarterly figures above:
| Criterion | Metric | Result | Score (0-100) | Weight | Weighted |
|---|---|---|---|---|---|
| Delivery | OTIF | 80% | 80 | 40% | 32.0 |
| Quality | Defect PPM | 3,000 PPM | 90 | 30% | 27.0 |
| Cost | Invoice accuracy | 86.4% | 86 | 20% | 17.2 |
| Responsiveness | PO acknowledgment | 90% | 90 | 10% | 9.0 |
| Total | 100% | 85.2 |
The quarter's OTIF of 80% is from all 20 lines (16 on time and in full), not the six-line September sample. The score for defect PPM uses a band you set in advance (here, under 1,000 PPM = 100, 1,000 to 5,000 PPM = 90). Agree the bands with the supplier before the quarter starts, so the score is a shared target rather than a surprise.
How often should supplier performance be reviewed?
Review supplier performance monthly for the few suppliers that make up most of your spend or supply a critical item, and quarterly for the rest. Calculate the metrics monthly either way; it takes minutes once GRNs are dated and rejects recorded. Hold a formal scorecard review with each key supplier once a quarter, and use the 12-month trend at contract renewal, which is where performance data feeds back into supplier selection (see source to contract vs procure to pay for where that hand-off sits).
The USPS manual names three uses for ratings: comparing similar suppliers objectively, choosing suppliers for recognition, and aiding future supplier selection. A fourth matters for small businesses: evidence. "Your OTIF was 62% last quarter on 34 lines" is a negotiation; "you are often late" is a complaint.
A walkthrough of four core supplier metrics with formulas and worked numbers: on-time delivery, rejection rate, lead time and pricing against the market, including why a supplier can pad lead time to hit its on-time number.
- 0:49 On-time delivery formula and a 95 of 100 example
- 2:02 Rejection rate: 25 defects in 1,000 units is 2.5%
- 3:36 Lead time from PO acceptance to shipment
- 4:48 How lead time differs from on-time delivery
- 5:34 Pricing compared with the market average
Where the data comes from in practice
Every metric above depends on three records being complete: a PO with due dates and agreed prices per line, a GRN dated on the day goods arrive with accepted and rejected quantities, and a supplier invoice matched against both. If GRNs are not raised, none of the delivery or quality metrics can be calculated, and the invoice is paid on trust. In India, the GRN date also matters for payment: under Section 15 of the MSMED Act, 2006, a buyer must pay a micro or small supplier within the agreed period, which cannot exceed 45 days from acceptance of the goods (see the Ministry of MSME's Samadhaan portal).
LuckPanda's Purchasing module keeps these three records together: purchase orders with line-level due dates and prices, receipts, and vendor bills matched against the order and what was received, so OTIF, fill rate and price variance can be read from one place instead of three spreadsheets. To start with the PO itself, use the free purchase order format. If you are setting up the request-and-approve step before the PO, see purchase requisitions.
Questions
What are the key supplier performance metrics?
The key supplier performance metrics are on-time delivery, OTIF, fill rate, defect rate or PPM, lead time and lead time variance, purchase price variance, invoice accuracy and PO acknowledgment rate. They cover delivery, quality, cost and responsiveness.
How do you calculate on time in full?
Divide the number of PO lines that arrived by the due date and with the full ordered quantity by the total PO lines due in the period, then multiply by 100. A line that is late, short or both is a miss.
How is supplier defect rate measured?
Divide units rejected for quality reasons by units received and multiply by 100 for a percentage, or by 1,000,000 for PPM. Exclude shortages and wrong deliveries, which belong in fill rate.
How often should supplier performance be reviewed?
Calculate metrics monthly. Review key suppliers monthly and others quarterly, hold a formal scorecard review with key suppliers each quarter, and use the 12-month trend at contract renewal.
What is the difference between OTD and OTIF?
On-time delivery only checks the date. OTIF checks the date and the quantity together, so OTIF is always equal to or lower than OTD.
What is a good OTIF score?
There is no universal benchmark; it depends on the item and how critical it is. Set the target in the supplier agreement, measure it the same way every month, and judge the trend. The video above suggests about 95% for on-time delivery as a starting target.
What is the difference between supplier KPIs and a vendor scorecard?
Supplier KPIs are the individual measurements, such as OTIF or defect PPM. A vendor scorecard combines several KPIs, each scored and weighted, into one rating per supplier per period.